Are your YouTube videos getting views but not converting into subscribers? Or maybe you're uploading consistently but growth has plateaued? The secret isn't just creating more content—it's understanding what your data is telling you. YouTube Analytics is like having a conversation with your audience, and most creators are missing half of what's being said.
According to recent studies, creators who actively use YouTube Analytics grow 3x faster than those who don't. Yet, 68% of YouTubers admit they rarely check their analytics beyond basic view counts. In this comprehensive guide, you'll learn how to transform raw data into actionable insights that accelerate your channel's growth.
We'll walk through the essential metrics every creator should monitor, decode what the numbers really mean, and show you exactly how to use this information to make smarter content decisions. Whether you're a beginner or experienced creator, these strategies will help you work smarter, not harder.
🎯 Understanding the YouTube Analytics Dashboard
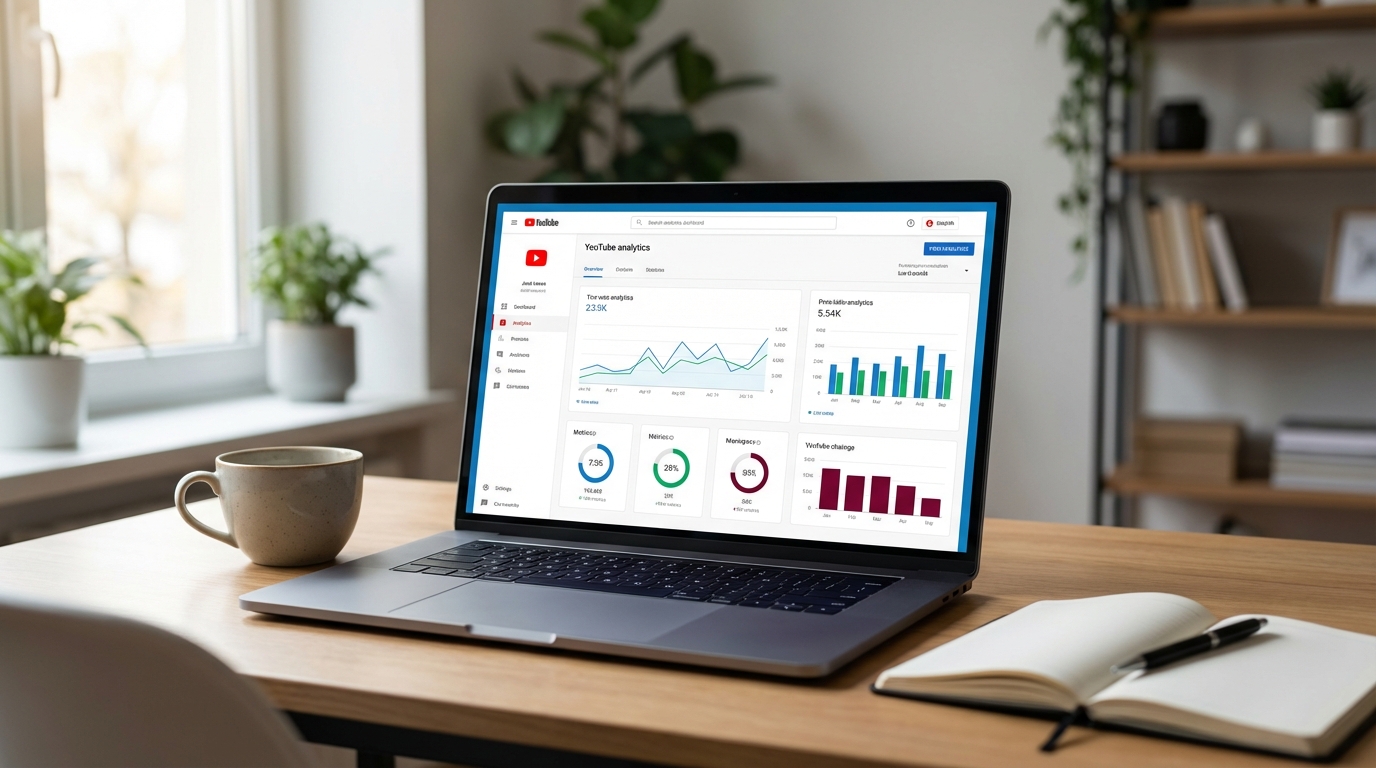
When you first open YouTube Studio and click on Analytics, you'll see four main tabs: Overview, Content, Audience, and Research. Each serves a distinct purpose in your growth strategy.
The Overview tab gives you a bird's-eye view of your channel's performance over the last 28 days (or any custom period you select). Here you'll find your total views, watch time, subscribers gained, and estimated revenue if you're monetized. But don't stop at these vanity metrics—they only tell part of the story.
The Content tab breaks down performance by individual videos, playlists, and even specific moments within videos. This is where you discover which content resonates and which falls flat. Pay special attention to the "Top videos" section to identify patterns in your most successful content.

📊 The 5 Metrics That Actually Matter
Not all metrics are created equal. While it's tempting to obsess over view counts, these five indicators provide the deepest insights into your channel's health and growth potential.
- Watch Time: The total minutes viewers spend watching your content. This is YouTube's #1 ranking factor because it directly correlates with viewer satisfaction and ad revenue potential.
- Average View Duration (AVD): How long people watch before clicking away. If your AVD is below 40% of your video length, you have a retention problem that needs immediate attention.
- Click-Through Rate (CTR): The percentage of people who click on your video after seeing the thumbnail. A CTR between 4-10% is considered healthy, but this varies by niche. Below 2% means your thumbnails and titles need work.
- Audience Retention Graph: This curve shows exactly where viewers drop off. Sharp drops indicate problematic moments—maybe your intro is too long, or a particular segment is boring.
- Traffic Source: Where your views come from (Browse Features, Suggested Videos, Search, External). Understanding this helps you optimize for the right discovery method.
💡 Pro Tip: Focus on improving one metric at a time. Trying to fix everything simultaneously leads to confusion about what actually worked.

🔍 Decoding Audience Retention: The Most Powerful Metric
If you could only track one metric, make it audience retention. This graph reveals the truth about your content's quality and helps you identify exactly what works and what doesn't.
When analyzing retention, look for these patterns: Initial drops in the first 15 seconds indicate your hook isn't strong enough. Gradual declines suggest your content is okay but not compelling. Spikes upward (when retention goes above 100%) mean viewers are rewatching that moment—this is gold! Note what you did there and replicate it.
Compare your retention curve to YouTube's benchmark for videos of similar length in your niche. If your curve is above average, you're doing something right. If it's below, analyze your top-performing videos to see what they have in common.
The "Key moments for audience retention" feature (if available for your video) automatically identifies the most rewatched and skipped sections. Use this to understand what content your audience craves and what they avoid.

🎬 Using Analytics to Improve Your Content Strategy
Data without action is just numbers. Here's how to translate analytics insights into concrete improvements for your channel.
Step 1: Identify your top 5 performing videos. Look beyond views—sort by watch time and engagement rate. What topics, formats, or styles do they share? This is your content blueprint.
Step 2: Analyze your worst performers. Find videos with low CTR (poor packaging), low AVD (weak content), or high bounce rates (misleading titles). Learn from these mistakes so you don't repeat them.
Step 3: Study your traffic sources. If most traffic comes from Browse Features, your thumbnails and titles are working. If it's mostly from Search, you're good at SEO but might be missing viral potential. If it's Suggested Videos, YouTube's algorithm likes your content—double down on similar topics.
Step 4: Monitor the "New vs Returning Viewers" metric. A healthy channel attracts new viewers while keeping existing ones coming back. If you're only getting new viewers, you're not building a loyal audience. If it's only returning viewers, your reach is stagnating.
👥 Understanding Your Audience Demographics
The Audience tab reveals who's watching your content—their age, gender, location, and when they're online. This information is crucial for tailoring your content and optimizing upload times.
Check the "When your viewers are on YouTube" heatmap. Publishing when your audience is most active increases the chances of immediate engagement, which signals to YouTube that your video is worth promoting. Most successful creators upload 2-3 hours before their peak audience time.
Geography matters too. If 60% of your viewers are from the United States but you upload at 2 PM Sydney time, you're publishing at 10 PM EST—not ideal. Adjust your schedule to match your primary audience's timezone.

💰 Revenue Analytics: Maximizing Monetization
For monetized channels, the Revenue tab shows RPM (Revenue Per Mille - earnings per 1,000 views), CPM (Cost Per Mille - advertiser spend), and revenue sources. Understanding these helps you maximize earnings.
RPM varies dramatically by niche. Finance and tech channels might see $10-30 RPM, while gaming or entertainment might be $2-8. If your RPM is low, consider: creating longer videos (more ad placements), targeting higher-CPM demographics, or diversifying income with channel memberships and Super Thanks.
The "Top earning videos" section shows which content types are most profitable. You might be surprised—sometimes your most viewed videos aren't your highest earners. Use this data to balance passion projects with revenue-generating content.
🔬 Advanced Analytics: Real-Time and Research Tools
The Real-time report shows how your latest video is performing in its first 48 hours—critical for understanding if your content is gaining traction. If views are flat after 24 hours, your thumbnail and title might need adjustment (yes, you can change them post-publish).
The Research tab is criminally underused. "Search terms from YouTube Search" shows what people are looking for that's related to your content. "Searches on YouTube" displays trending queries in your niche. Use these to generate video ideas that have proven demand.
The "Viewer's other subscriptions" feature reveals what channels your audience also watches. This helps you understand your competitive landscape and identify collaboration opportunities with creators who share your audience.
📈 Setting Meaningful Goals and Tracking Progress
Analytics become truly powerful when you set specific, measurable goals. Instead of "get more views," try "increase average view duration from 4:30 to 6:00 minutes over the next month."
Create a simple tracking spreadsheet with these columns: Date, Video Title, Views, Watch Time, CTR, AVD, and Notes. Review it weekly to spot trends. Are your tutorial videos consistently outperforming vlogs? Is your CTR improving after changing your thumbnail style?
Use YouTube's "Compare to past period" feature to measure growth. Comparing this month to last month shows immediate progress, while year-over-year comparisons reveal long-term trends and seasonal patterns.
💡 Pro Tip: Set up automated reports in YouTube Studio to receive weekly or monthly summaries via email. This keeps analytics top-of-mind without requiring daily checking.
🚫 Common Analytics Mistakes to Avoid
Even experienced creators fall into these traps. Avoid them to make better data-driven decisions:
- Checking analytics too frequently: Daily fluctuations are normal. Wait at least 48 hours before judging a video's performance, and use 7-28 day periods for meaningful insights.
- Comparing your channel to others: Different niches have different benchmarks. A 5% CTR might be excellent for one category but poor for another. Compare yourself to your own past performance.
- Ignoring older videos: Your back catalog can be a growth engine. Check "Returning viewers" and "Browse features" to see which old videos are still attracting traffic, then create follow-up content.
- Overreacting to one bad video: Every creator has flops. One underperformer doesn't define your channel. Look for patterns across multiple videos before changing your entire strategy.
- Forgetting external traffic: If you promote on Instagram, Twitter, or your website, that traffic shows as "External." Don't discount it—diversified traffic sources build a more sustainable channel.
✨ Putting It All Together: Your Monthly Analytics Routine
Here's a practical routine to make analytics a habit without getting overwhelmed:
Weekly (15 minutes): Check your latest videos' performance. Note CTR and AVD. If either is significantly below your channel average, brainstorm why and adjust future content accordingly.
Monthly (1 hour): Deep dive into your top 5 and bottom 5 videos. What patterns emerge? Update your content calendar based on what's working. Check the Research tab for new video ideas. Review audience demographics for any shifts.
Quarterly (2 hours): Comprehensive channel audit. Compare this quarter to last quarter across all major metrics. Are you achieving your goals? What needs to change? Update your strategy document.
Remember, analytics are a tool for improvement, not a source of stress. The goal isn't perfection—it's progress. Every insight you gain and implement moves you closer to building a thriving YouTube channel.